Monitoring your jobs #
Console output of your tasks is piped back into your shell on the head node.
Our cluster provides monitoring dashboards to view current jobs and job archive, as well as an overview of available resources. Check out the list of available dashboards if you need additional information.
You need to be connected to DFKI intranet to access these dashboards. Use VPN when you’re not on premise.
You can further log into a worker node via ssh while one of
your jobs is running there and use htop as usual.
Grafana dashboards #
While htop may provide a very detailed view of the current behavior
of your jobs, our Grafana dashboards are a convenient way to analyze
how they perform over their whole runtime.
Current jobs / Archive #
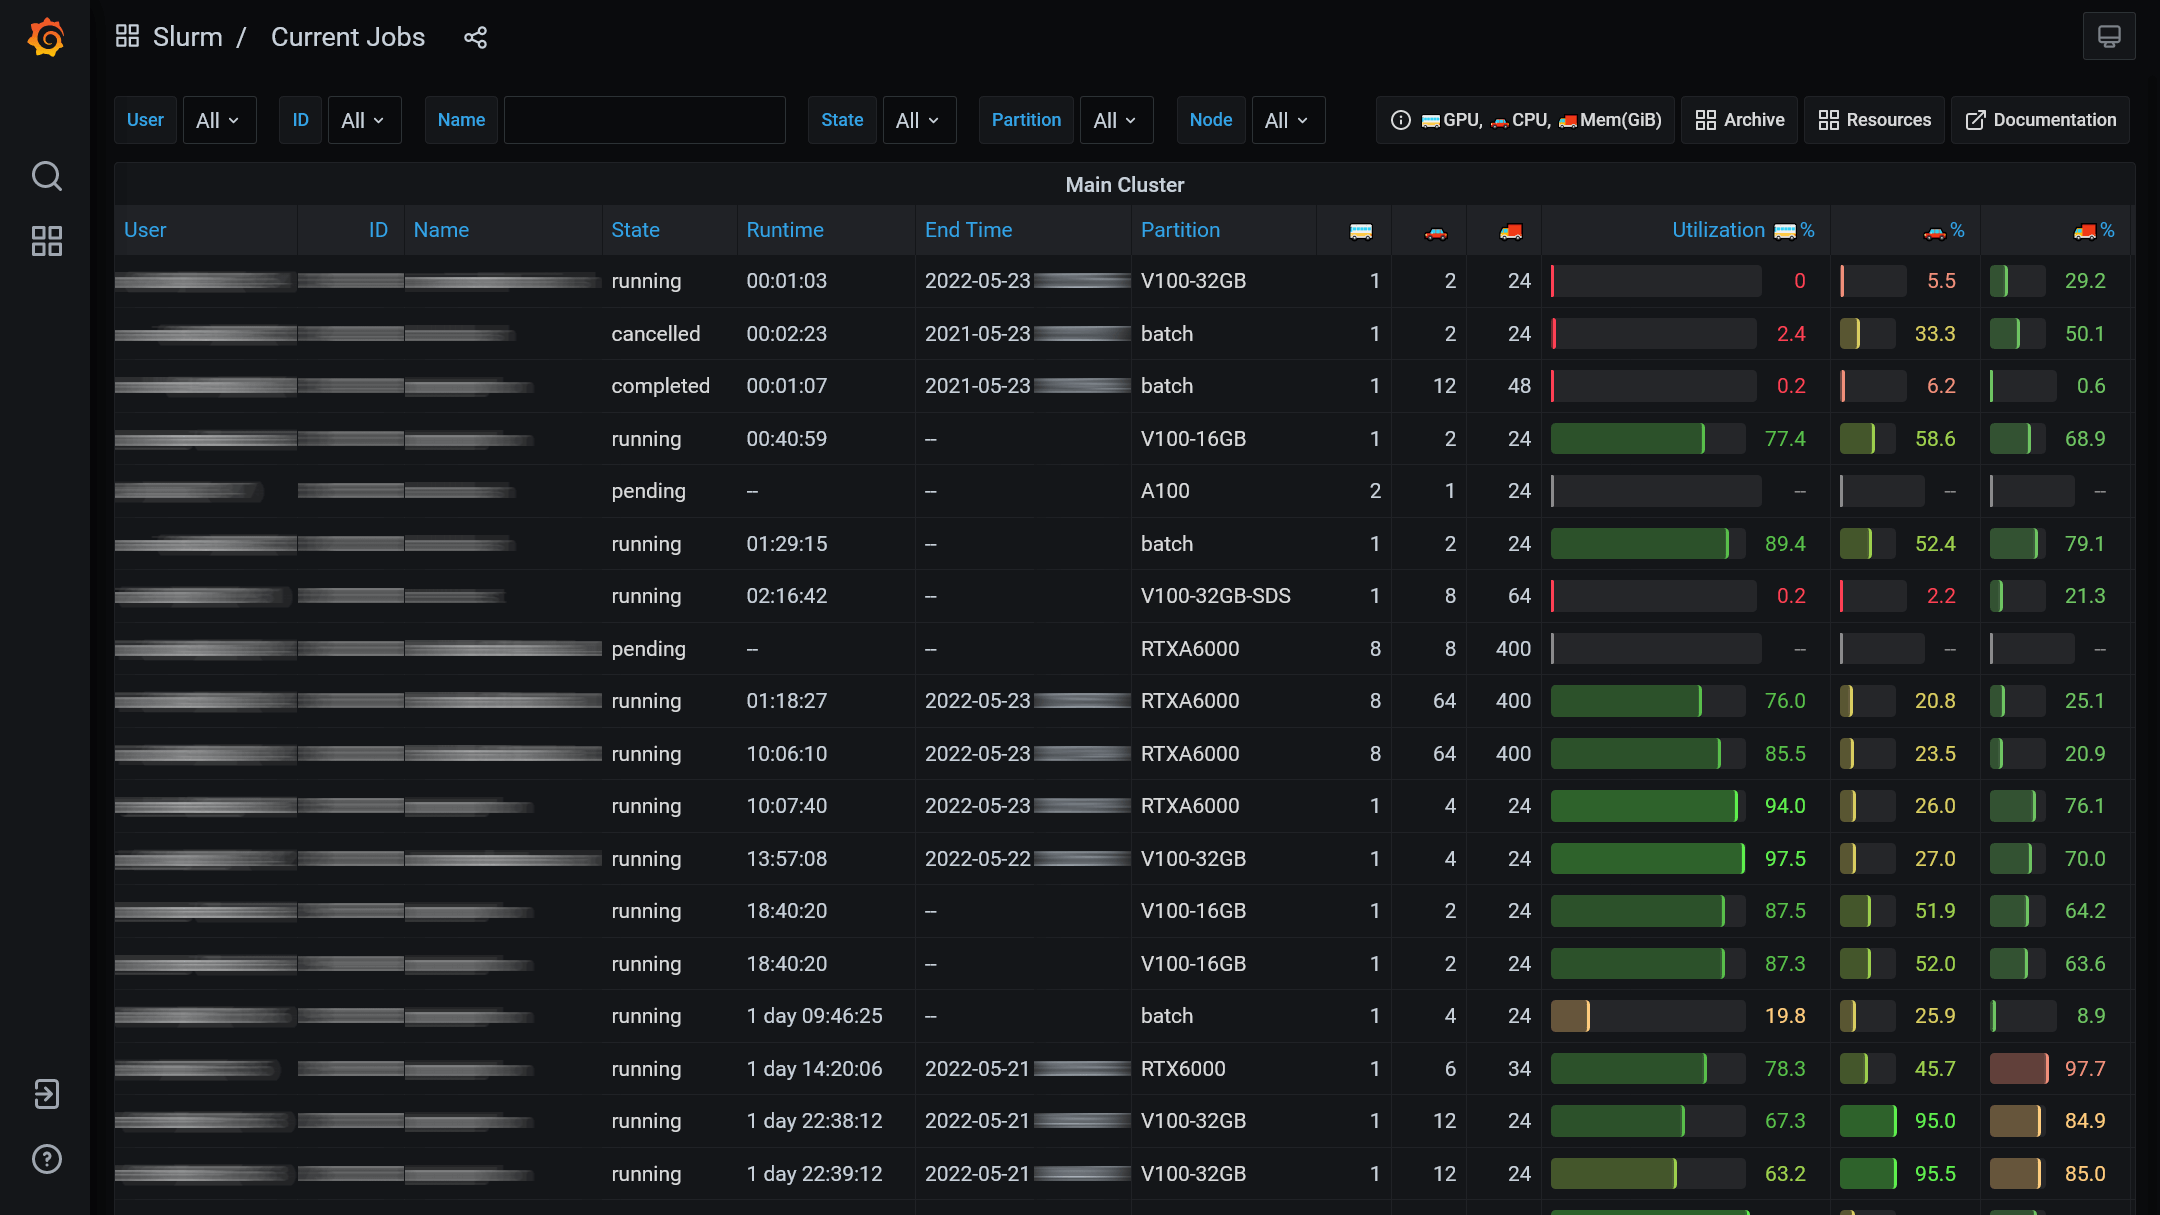
These dashboards provide an overview of current and past jobs.
They provide a variety of filtering options:
- User: Filter by user(s). For example, only your own jobs.
- ID: Filter by job ID(s). Type in the ID(s) you want to see.
- Name: Filter by job name.
Type in words you want to find.
You can search with wildcards
%, alternativestest|pythonand much more. See postgres pattern matching for more details. - State: Filter by job state.
- Partition: Filter by partition.
- Node: Filter by node. Shows jobs that have at least one of the selected nodes in their node list.
The archive dashboard further allows you to filter by time. All jobs that either started or finished within the selected time frame are shown.
Most of the table cells are clickable. User, state, and partition columns select the value of the clicked cell as filter. For example, clicking on a username will show all jobs of that user. Clicking in the ID or name column opens the job details dashboard for that job.
The bars on the right give a quick overview of the average GPU, CPU, and memory usage of each job.
Job details #
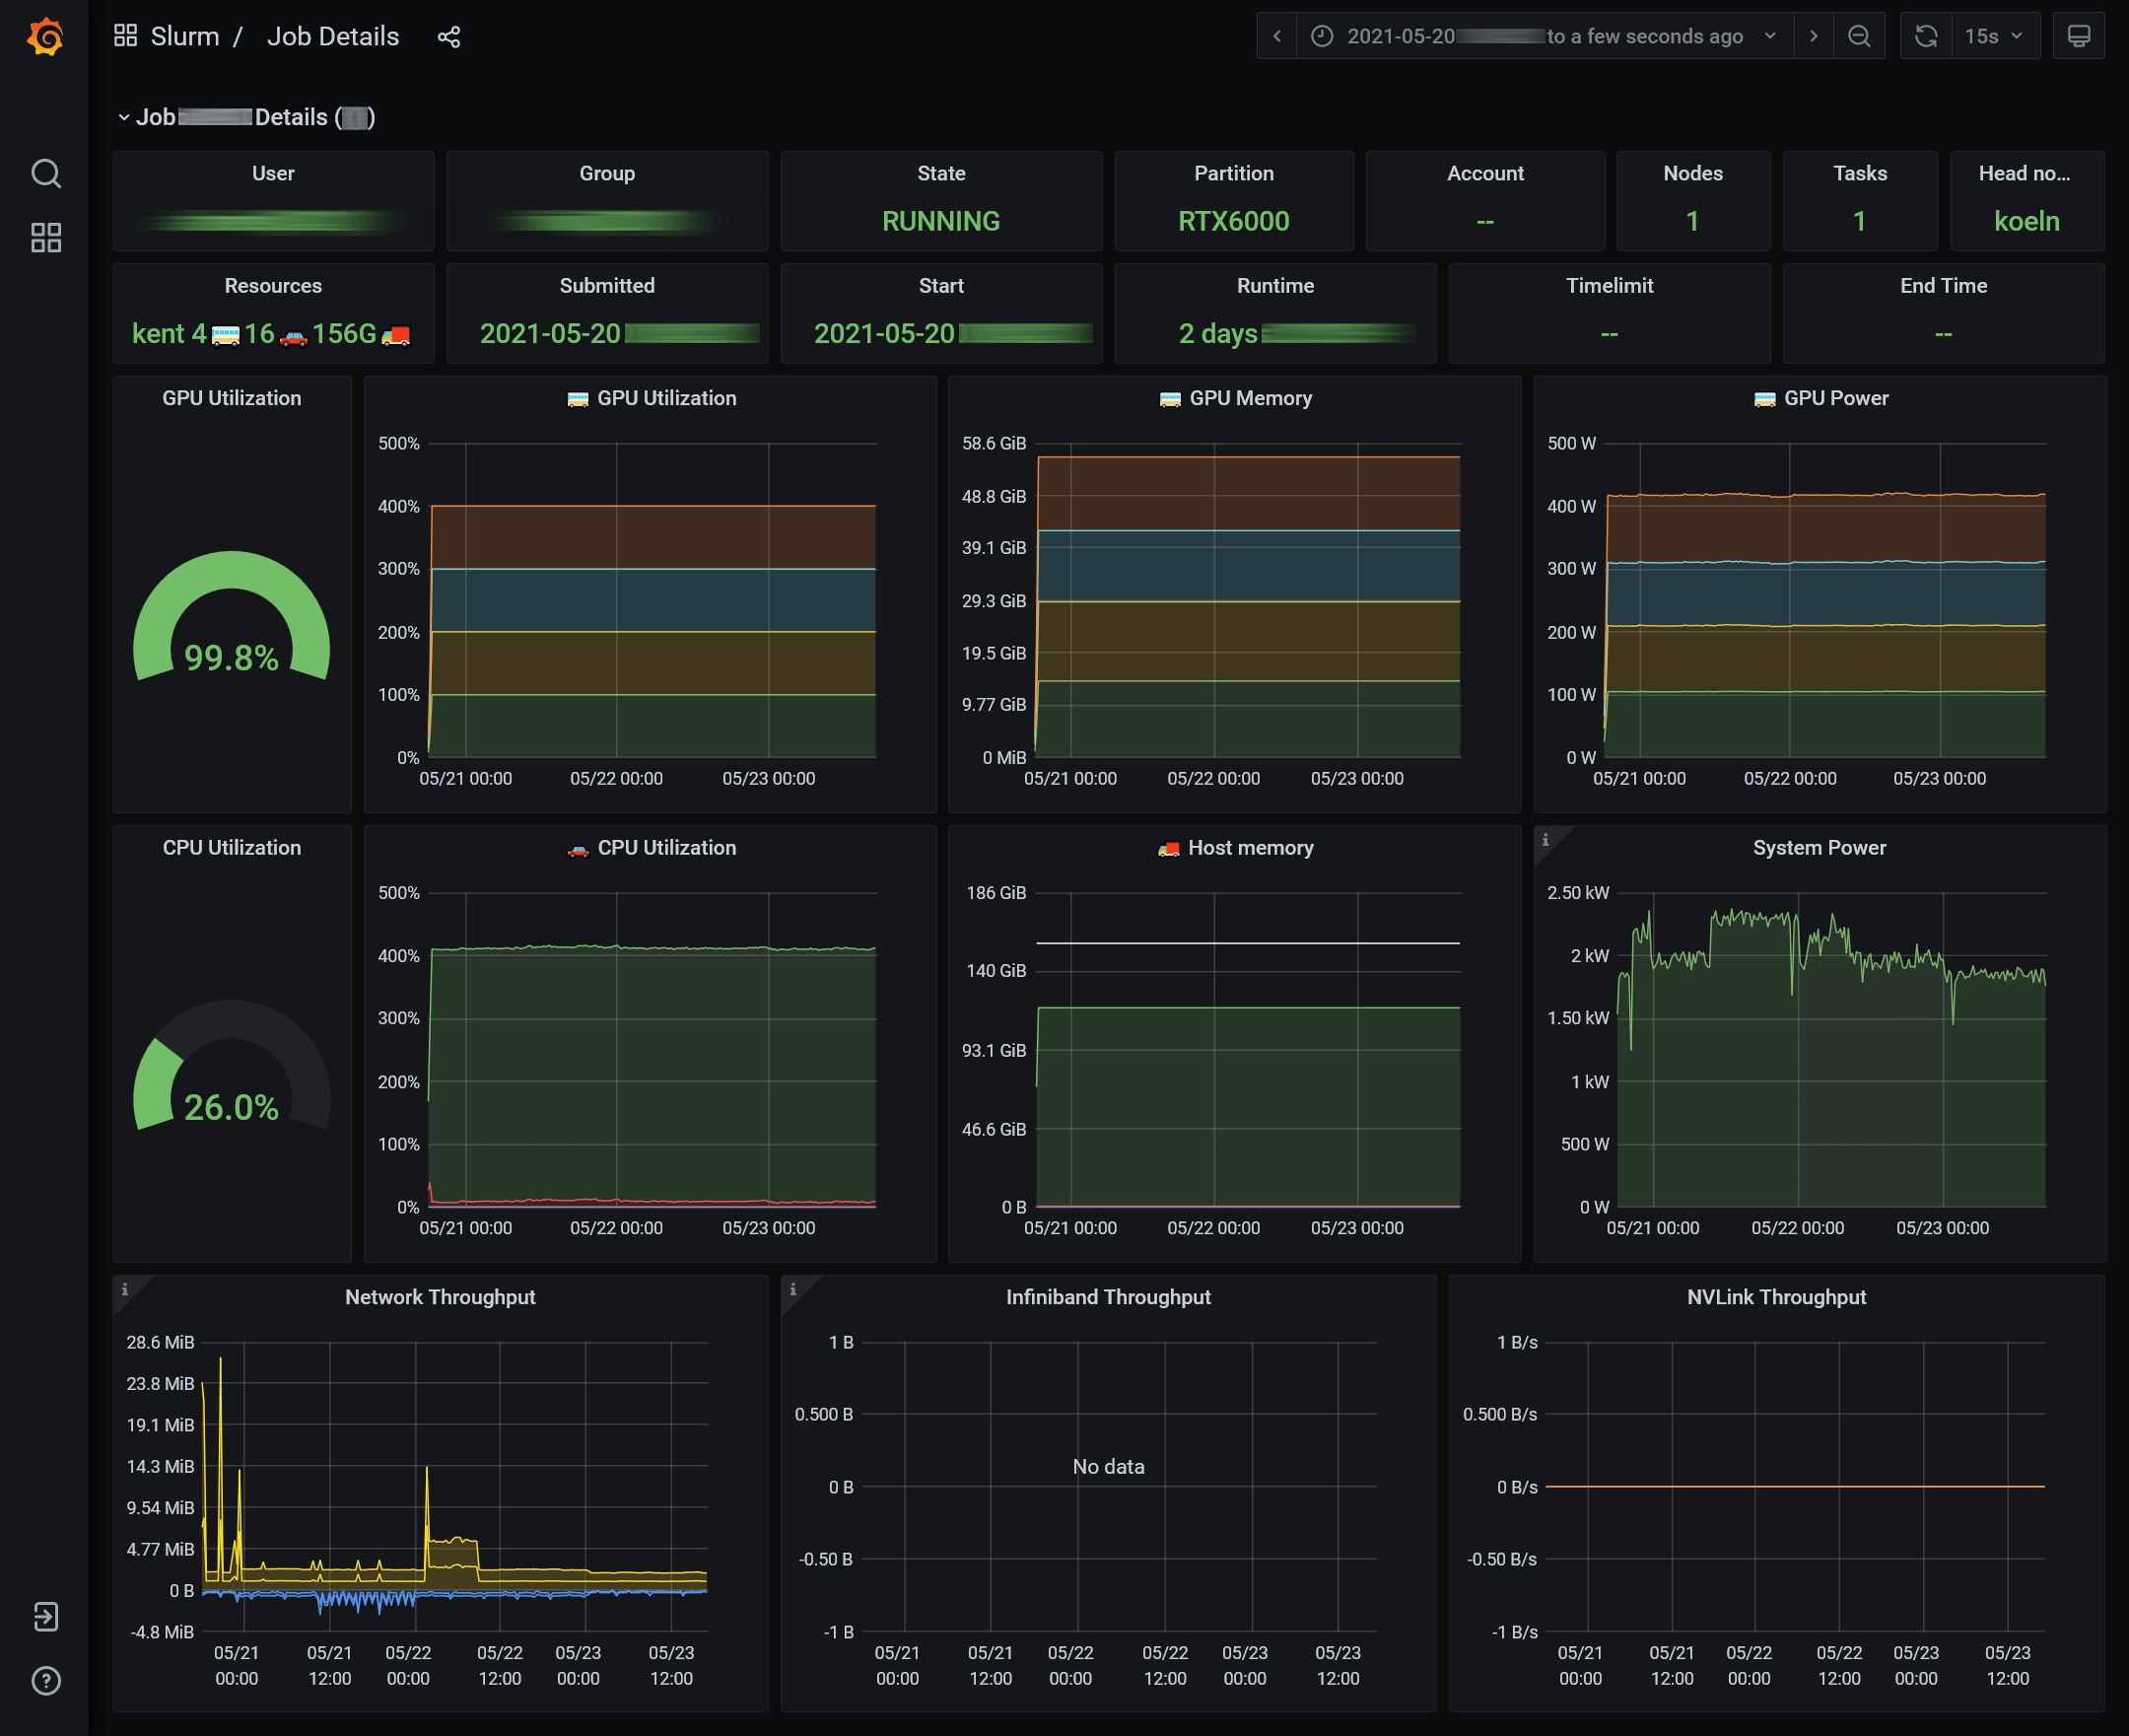
Clicking on the ID or name of a job opens the job details dashboard. Here you will find graphs that show how the job used the allocated resources during its runtime.
Watch these for any unusual behavior. Typical problems are:
- Overloaded CPUs
- Full memory, sometimes with swap usage
- Inactive GPUs
- Intermittent usage with long pauses between activity
- Very low GPU activity (is using a GPU even beneficial?)
- …
System power, network throughput, and InfiniBand throughput cannot be measured on the job level. Hence, the shown values are for whole node(s).
For more info about your jobs, you can enabled logging of the console output.
Resources #
Gives an overview of the current load on the cluster. Shows how many jobs are active for each partition, along with reserved, free, and queued resources. Use this to select which partition(s) to use for your next job.
Job statistics #
Shows how the cluster is used over time. How many jobs are submitted during a week and at what time. Probably not terribly useful unless you like looking at pretty graphs.
Notifications #
You can also let Slurm notify you via email whenever a job changes state.
Add --mail-type (when to send messages)
and --mail-user (address to send them to)
options to your command line, e.g.:
$ srun --mail-type=ALL --mail-user=gottfried.leibniz@dfki.de [your command]
Contrary to the name, the value ALL for --mail--type is equivalent to
BEGIN,END,FAIL,INVALID_DEPEND,REQUEUE,STAGE_OUT.
Other values like TIME_LIMIT_90 to be notified when a job reaches 90% of
its time limit, are also available.
See
the srun documentation for
more details.
Email addresses do not need to be @dfki.de, other domains work just as well.


