Logging #
The functionality described here is a work in progress. It may change without notice. Data loss may occur. You have been warned.
Our cluster can log the console output of your jobs.
This function is opt-in and therfore disabled by default.
To enable it, create a file called .logoptin in your home directory,
e.g., by running this command on a head node:
touch ~/.logoptin
Remove said file if you no longer want the output logged:
rm ~/.logoptin
The existence of the .logoptin file is checked when a job first starts.
Adding/removing it while a job is running will not start/stop
logging of that job.
Logs can be viewed by everyone with access to the job details dashboard, so beware of printing any secrets (passwords, tokens, …) while opted in.
Only stdout is currently displayed in dashboards and used to extract metadata. Stderr is logged, but currently not used for anything.
Configuration #
After opting in you can further configure logging. There are currently two ways to do this:
- Via your
.logoptinfile. This configuration is applied when a job starts. - Commands sent to the logger on stdout/stderr during job execution. Changes made this way only apply to the job that sent the command.
More details after the available options.
Available options #
The following options are available.
mode #
Operation mode of the logger.
There are three possible values:
enabled: All output is logged. The default for opted in users.metadata: Only extracted metadata is logged.disabled: The logger listens for commands and outputs them. Any other output is dropped.
You can use mode to, e.g., put the logger into disabled mode in your
.logoptin file,
let your jobs perform operations that require some kind of secret
(e.g. usernames, passwords, tokens) and switch to enabled later.
Alternatively, use metadata if you want to keep your logs private,
but still use the
features
described below.
Configuration in .logoptin
#
Your personal configuration applied when a job starts
is stored in your .logoptin file.
It uses YAML syntax.
An empty file is equivalent to the default configuration:
mode: enabled
Configuration commands #
Commands to update configuration can be sent to the logger on stdout and stderr.
Commands start with /LOGCOMMAND followed by a single whitespace and a JSON message.
Example:
/LOGCOMMAND {"mode":"metadata"}
Configuration changes apply to both stdout and stderr. No guarantee of order between streams is made, so beware of race conditions. Send commands on the respective stream if you want to protect sensitive output.
Extracted metadata #
Logs are displayed in the job details dashboard. Along with the raw text, the cluster can also extract metadata from your logs when printed as one JSON object per line (like ndjson or jsonlines). Here are some examples of valid metadata:
{"epoch": 1, "loss": 7.2355865, "acc": 0.00123}
{"step": 151100, "lr": 0.07938926, "flops": 789773523480.1762, "time": 16520}
{"size": "big", "speed": "slow", "lr": 0.1}
Metadata lines must be valid JSON and there can be no other
text on the same line, including leading and trailing spaces.
In particular, printing Python dict does not work.Metadata is displayed as both tables and graphs (numeric values only). Tables are sorted by timestamp (newest-first). Graphs are by time or by some X value selected in the following order. If there are multiple alternatives, the first in alphabetic order is chosen.
- Value
"progress" - Value
"epoch" - Monotonically increasing integers
- Monotonically increasing numbers
- Integers with any monotonicity
- Numbers with any monotonicity
- Any numbers
Epochs are a common occurrence for many types of jobs, however, you may want to define a custom “progress” value to improve comparability between jobs with different numbers of epochs. “progress” may be any kind of numeric value, e.g., a percentage of how far the job has progressed.
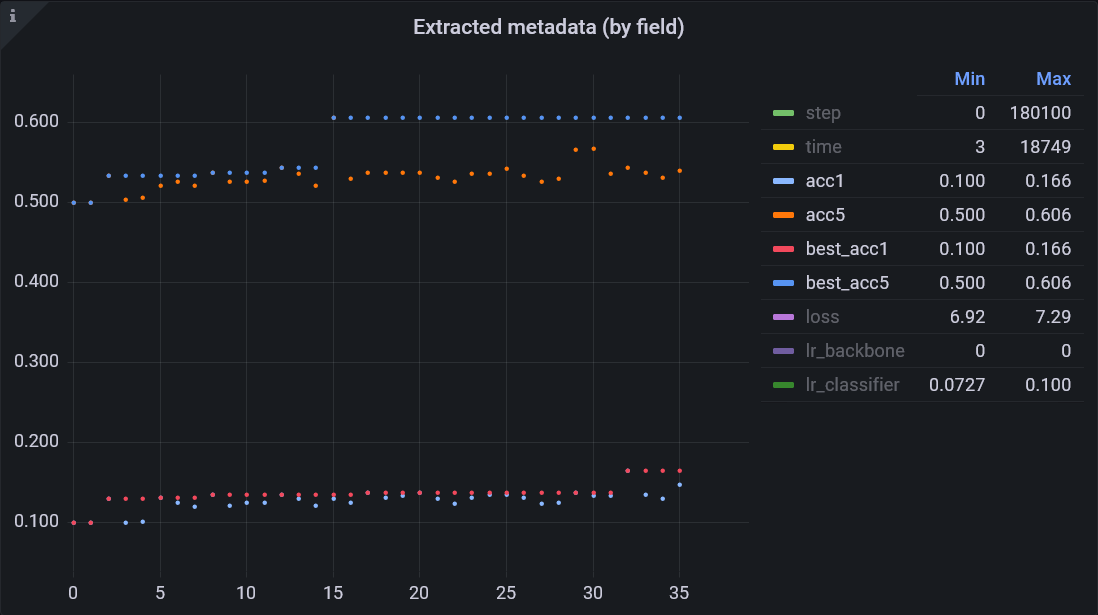
Example of an XY graph by epoch:

You can click on any entry in the legend to display only that series. Ctrl+click turns individual series on or off.
Limits & Quotas #
As of right now, there are is no usage quota, only a (very generous) limit on throughput. Printing many thousands of lines per second may result in your job slowing down.
There are further measures in place to reduce the size of logs:
- Output is rendered as it would appear on a console. E.g., only the final state of progress bars is logged.
- Repeated lines may be dropped. A message will indicate how repetitions were dropped.
- Multiple empty lines are dropped.
Future plans #
If user authentication can be enabled in Grafana, we could:
- Show logs only to the specific user
- Allow users to create custom dashboards to compare jobs, create custom graphs, etc.
- Allow users to download their own metadata
